
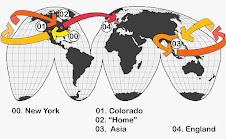
These are a few pages from my Asia journal.
Yes, they indeed show a ridiculously anal, itemized account of our every expense.
Yes, we actually wrote it all down.
And yes, I am actually admitting to it.
Now most people might guess that this was done to keep ourselves on budget. That is not exactly true: it helped us spend more! Our trip proved what Josh and I already suspected: we are incredibly cheap, don't like to spend money, and are fairly good at not doing it (plus we complain when we do). How else would we have been able to save up enough to take off for 8 months so soon after living as grad students in New York City? Saving a dollar here and a dollar there may not add up to much, but when a dollar here is a meal there and a dollar there is a quarter of a night's stay somewhere else, each cheap peanut butter and jelly sandwich contributes!
So the accounting was actually a necessity to prove to ourselves that we were indeed well under or at budget. It allowed us to spend more, to splurge on things like Mr. Minh's moto tour and a second round of diving in Malaysia. But what's fun right now is that it let us figure out just where our money went... thanks to Microsoft Excel! So get ready for some fun and crazy statistics from the spreadsheet from hell.
Here’s just a sample:
We spent more time waiting at the airport than on airplanes.
We spent almost 9.5 days on buses.
66% of our guest house rooms had attached bathrooms.
Our cheapest night cost us less than $2.
We saw four dead people on the trip.
Bangladesh has the best tea.
We had ice cream 47% of our days out.
Find out what ridiculous percentage of our money was spent on transport (plus some other interesting stuff).
Let's start with some graphs.
First, here's how our expenses divided up: We can't believe that our transportation took up 37% of our total expenses, especially since we usually took the low-budget routes. I guess it makes sense- we covered A LOT of ground in 5 months. I think we could have done the same trip in a year and things would have evened out a bit. As for our pre-trip expenses, we had to get almost every vaccine known to humankind, so this includes things like my final Hep A&B and Josh's Tetanus booster. We did take malaria medication for much of the trip, but that was the cheap Walmart variety. Our insurance was only about $420 for the 5 months. Still, altogether pricey! Finally, that diving amount both horrifies and comforts me. We spent so much! But think of how much our trip really cost if you don't include that splurge...
A country by country account also reflects where we dove: We included the costs of transportation in the country totals (unlike the daily amounts budgeted by guidebooks like Lonely Planet which do not), but not any flights between them. It's also interesting to compare the graph above with the number of days we spent in each country below:
 That gives you an idea of which countries cost more on a day to day basis. A little strange that Bangladesh and Cambodia ended up so high, but the reasons are on the chart:
Did you notice those exchange rates listed? We really did take out over a million (dong) from an atm in Vietnam! Also, the largest denomination of Myanmar currency kyat (pronounced chat) is a 1000 kyat note. One USD is about 1200 kyat, so when we changed a few hundred dollars worth, we basically ended up with a few hundred dollars worth of one dollar bills to carry around!
We've got a whole lot more random stats, but I think we'll put those in a second post. One can get too much of a good thing, I think, even with statistics. So stay tuned for such tid-bits as...
Our cheapest full meal cost $.50 while the most expensive was $50.
25% of our guest house rooms had TVs.
We covered an area roughly the size of the United States.
We encountered 1 almost-charging rhino and 5 Feenstras on the trip.
Sunday, November 11, 2007
Statistics made fun! (1 of 2)
![]()
Subscribe to:
Post Comments (Atom)
7 comments:
WOW!!! And I thought our budget numbers got crazy. Like when I go to the bank and ask for 2 $100, 4 $50, 3 $20's ect. But....all your figures and pie charts put Matt to shame!! Don't tell him I told you that! It is quite interesting how much you spent a day... I guess I always wondered. Thanks for all those tidbits I needed to know!!! Too bad you didn't encounter 6 Feenstra's!
amazing meg! Put those columbia education to good use! :)
Thanks to Stacey for sharing this link:
http://movies.apple.com/movies/
us/apple/getamac_ads2/
work_480x376.mov
Kinda fits the post! It's almost like you were there with us now, isn't it? :)
-meg
PS the next stats post is funnier and even more informative... just you wait!
http://movies.apple.com/movies/us/apple/getamac_ads2/work_480x376.mov
Ack. Whatever. That first link is correct, you just have to make sure you copy all the lines. The second one only shows up in entirety at the bottom of the post and not on the comments-only page. Sorry about that.
OK, so you guys are into the PC mode of fun - and explaining the vacation in pie charts. Very funny! Loved the video. But I did notice that you FIRST told us your stories with pictures and narrative and THEN got to the pie charts. So I guess you are not too compulsive. :) Besides, I think numbers are kinda fun too.
Post a Comment